Goal: When you have finished this laboratory exercise you will understand
- the membrane filtration process as applied in the food industry
and you will learn
- how to use a mathematical model to determine the effect of pressure differential across the filter on the flux performance during an ultra-filtration process.
-
Use of membrane separation systems in food industry is now becoming very common.
Some of the typical food-related applications include purification of water and concentration and clarification of fruit juices, milk products, alcoholic beverages and wastewater.
In a membrane separation system, a fluid containing two or more components is in contact with a membrane that permits selected components (for example, water in the fluid) to permeate more readily than other components.
The physical and chemical nature of membrane (pore size and pore-size distribution) affect the separation of liquid streams. -
Permeation of the selected components is the result of a driving force.
Ultrafiltration membranes are used primarily for fractionating purposes: that is to separate high molecular weight solutes from those with low molecular weight.
Principle of ultra-filtration is physical separation where the extent of removing substances is determined by the size of pores in the membranes.
Most common use of ultrafiltration has been in the dairy and fruit juice industries.
-
Raw apple juice will be prepared by mashing the apples in a blender and then pressing the juice through a cloth.
After heating the raw juice to around 50oC, it will be treated with a pectolytic enzyme mixture and amylase for degradation of pectin and starch.
After confirmation of degradation by alcohol and iodine tests, a gelatin bentonite mixture (in a ratio of 1:5) will be added to the juice to maintain an optimum aggregation.
After 30 min for flocculation, the ultra-filtration experiment will be conducted. -
The experiment set-up will consist of the following components:
- a pressure supply with compressed nitrogen gas, and
- an ultra-filtration unit (Amicon 8200 model ultrafiltration cell; 180 ml and 64 mm in diameter).
Flux experiments will be performed using a membrane with molecular weight cut-off (MWCO) of 10 kDa with a filtration area of 32 cm2.
-
Filtration may be defined as the process of moving a fluid containing suspended particles through a porous medium.
One of the best examples of the filtration process in the food industry is the clarification of fruit juices.
When membrane filtration is used for the removal of larger particles, micro filtration and ultra filtration are applied.
The principle of ultra-filtration is physical separation where the extent of removing the substance is determined by the size of the pores in the membranes. -
Ultra-filtration is a pressure-dependent process, and the performance of membrane filtration processes is influenced by membrane material, membrane pore size, feeding velocity, temperature and trans-membrane pressure drop.
Since the ultra-filtration process is pressure-dependent, there would be a significant effect of the applied pressure on the formation of fouling layer resistance and the resulting permeate flux decline.
In this experiment, we will determine the effect of pressure differential across the filter on the flux performance during ultra-filtration. -
Variation in membrane resistance and fouling coefficient of De La Garza and Boulton's exponential model with the applied pressure will be determined.
The data analysis will include the required mathematical approaches to determine the required parameters for the given exponential model.
-
In this laboratory exercise, you obtained data on the change in the time to collect 150 ml of the permeate under a given constant pressure. We will analyze this data using the exponential model of De La Garza and Boulton to determine the membrane resistance (Rm) and fouling coefficient (k)
For this purpose, the following equation, obtained from the De La Garza and Boulton equation and general filtration model, will be applied: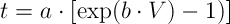
where
-
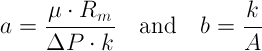
Knowing "a" and "b" values we can calculate Rm and k. To determine the "a" and "b" values from the experimental data, we will apply the following procedure:
1. Copy the experimentally obtained t-V data in a new Excel file.
2. Since the volume data is reported in ml, we should first convert it to m3.
3. To facilitate the spreadsheet calculations for determining the "a" and "b" values, the previous equation may be modified as:
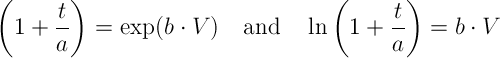
where the slope of the ln(1+t/a) versus V results in "b". To determine "a", we will follow a trial and error procedure.
-
4. For this objective, a guessed "a" value lets us determine the slope of ln(1+t/a) versus V, and the intercept of this plot must be "0". Therefore, in the Excel spreadsheet in a separate column, the values of ln(1+t/a) will be determined.
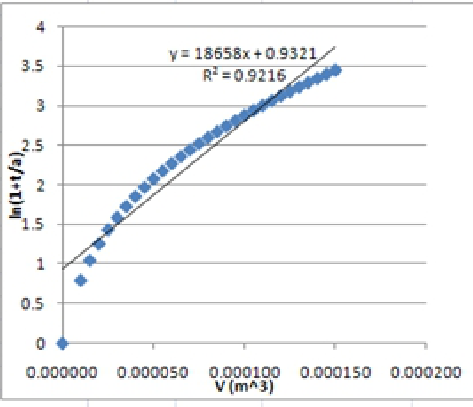
5. Since we now have ln(1+t/a) versus V data, we can easily determine the slope and check the intercept value using the "Trendline" option or "Intercept" worksheet function (See the following figure). To decide on how one may change the guessed "a" value, sum of squares analysis can also be used: -
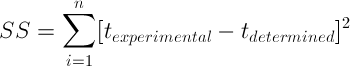
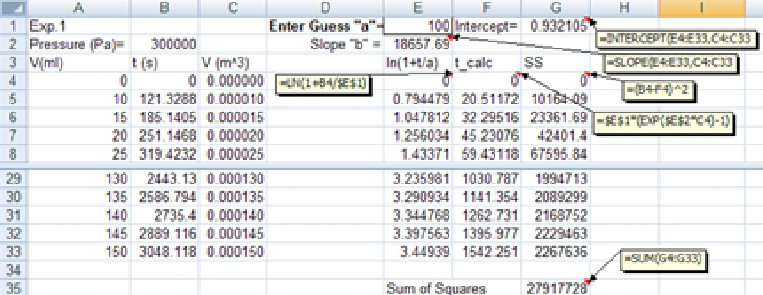
The tdetermined values are calculated from the values of ln(1+t/s).
See plot on next page. -
-
6. Then, the Rm and k values can be calculated with the known ΔP, A and μ; values. The viscosity of the apple juice can be assumed to be equal to that of water (0.001 Pa-s).
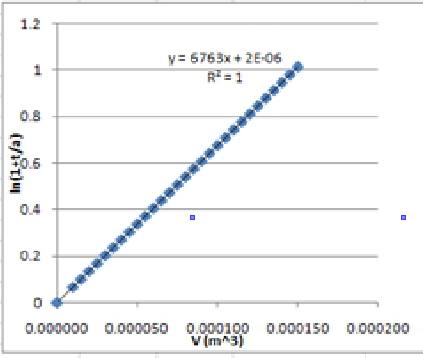
7. In addition to previous steps, a Goal Seek procedure in Excel can also be easily applied. For this purpose, after the spreadsheet is prepared, as explained above, to determine the t-values, the Goal Seek procedure is applied by setting the cell G35 (where SS value is calculated-fig.21.4) to Set Cell box, 0 to To value box and cell G1 (the guess "a" value) to By changing cell box. For this example, you will obtain a ≈ 1734 (s), b ≈ 6763.01 (m3). These values satisfy the conditions (intercept ∼ 0). -
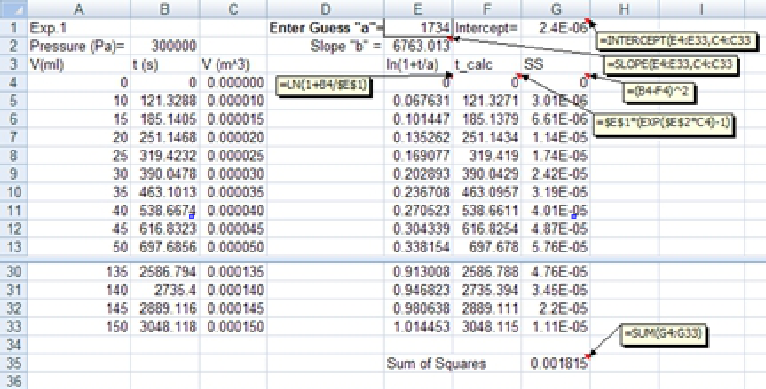
Note the extremely small value of the Sum of Squares. See plot on the next page.
-
- What can you infer from the change in membrane resistance (Rm) and fouling coefficient (k) with the applied pressure?
- What is the role of the effect of pressure on the membrane resistance and fouling coefficient?
- What is the effect of pressure on the total resistance?
- Does the pressure influence total resistance in the same manner as Rm and k? Why?
- Capra, S.C. and Canale, R.P. (1990). "Numerical Methods for Engineers," McGraw-Hill, New York, N.Y.
- De La Garz, F. and Boulton, R. (1984). "The modeling of wine filtrations," American J. Enology and Viticulture 35:189-195.