Goal: When you have finished this laboratory exercise you will understand
- the role of time constant in selecting temperature sensors
and you will learn
- what is time constant
- how to measure response of temperature sensors when they are exposed to a sudden change in the environmental temperature
- how to differentiate between temperature sensors based on their response
-
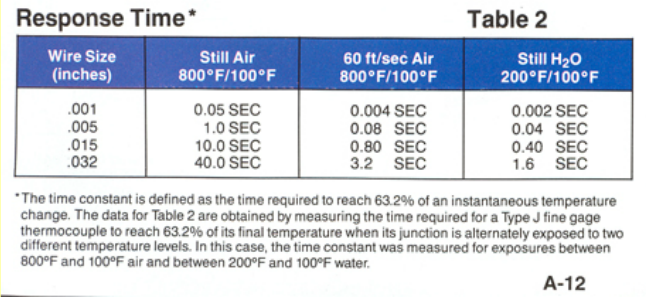
In purchasing sensors, an important specification of a sensor is its time constant. Time constant is a quantitative way to express how fast or slow a sensor responds to a change in environment. Without this information, you may select a sensor that is too fast or too slow to respond and therefore may not be the right choice for the given application. Time constants are expressed in the units of time. Following is an example of a catalog entry for a temperature sensor with its time constant.
-
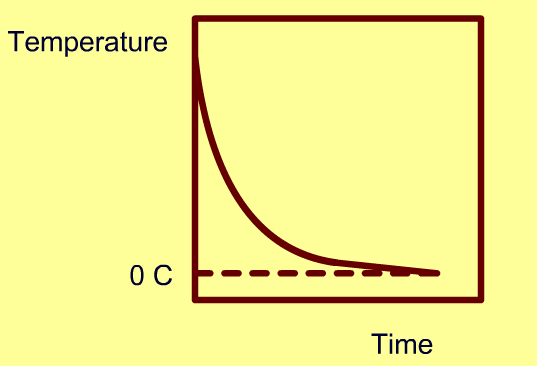
The time constant of a temperature sensor is determined by first letting the sensor equilibrate to ambient temperature and then suddenly exposing it to a step change in temperature. The temperature response of the sensor to the step change is then recorded. The temperature-time data obtained from the sensor, during the step change only, is then analyzed to determine the time constnat. In a laboratory experiment, we use different sensors to measure their time constant. The following steps are for determining time constant of a thermocouple.
-
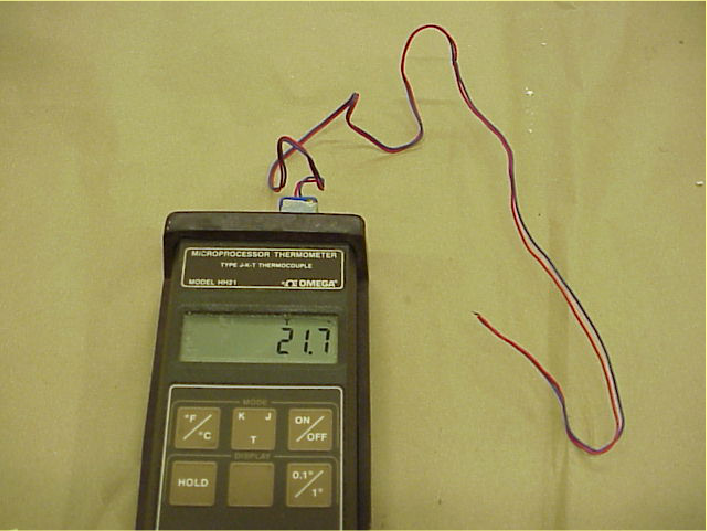
1) Equilibrate the thermocouple to ambient temperature. Equilibrium is indicated when there is no appreciable change in the temperature indicated only by the thermocouple.
-
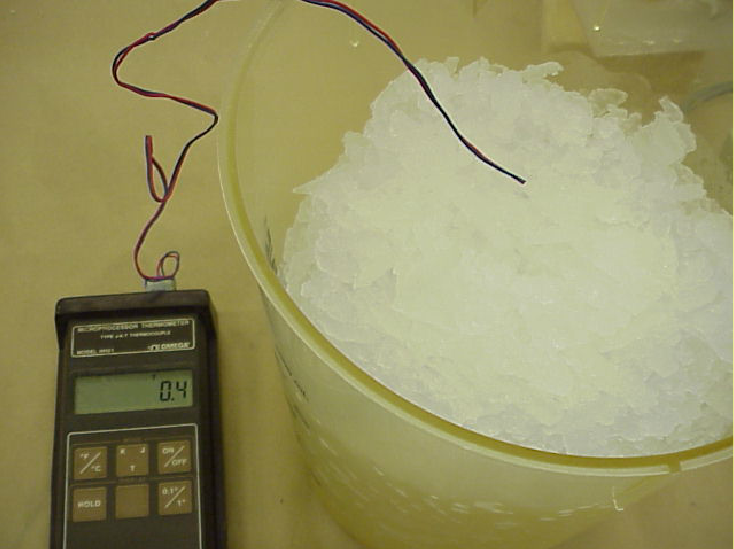
2) Place the thermocouple's measuring junction in the ice bath. This creates a sudden change in temperature.
-
3) Continue recording temperature until the thermocouple reaches approximately the ice bath temperature (Note: it is not necessary for the thermocouple to reach exactly the ice bath temperature).
-
4) Repeat the trial with other types of sensors.
-
In the virtual experiment select one or more of the four sensors. Enter the initial and medium temperatures. You will view a plot of temperature vs. time for each sensor and obtain numerical data on a spreadsheet.
-
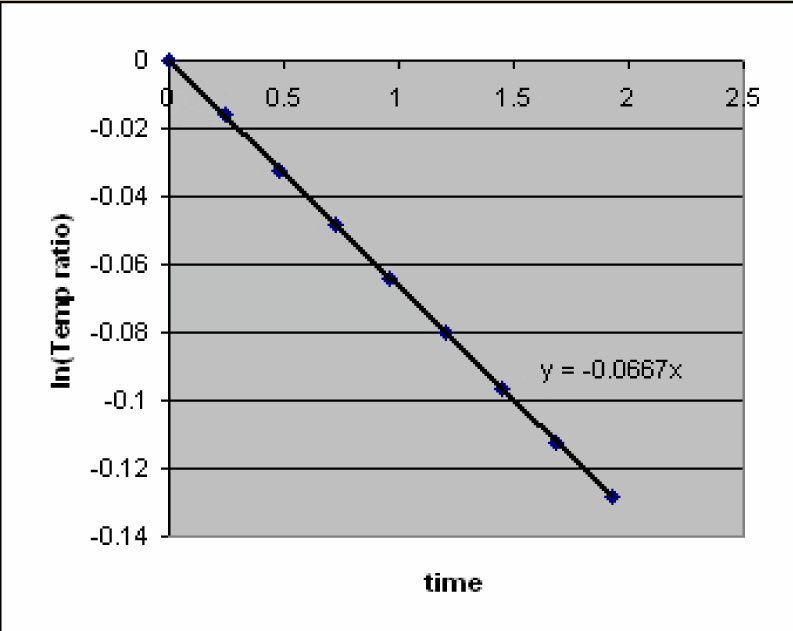
The time constant is defined as the time required by a sensor to reach 63.2% of a step change in temperature under a specified set of conditions.
The response of a sensor to a suden change in the surrounding temperature is exponential and it is described by the following equation:
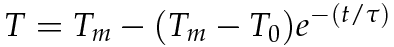
where T is sensor temperature, Tm is the surrounding medium temperature, T0 is the initial sensor temperature, t is the time and τ is the time constant. We will rearrange the above equation on the next slide.
-
The previous equation may be rearranged as follows:
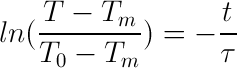
And, the time constant is obtained by plotting
 . The time constant is determined by the inverse of the slope
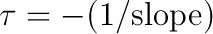
The time constant multiplied by five yields the time for the sensor to stabilize at close to 100% of the step change value.
-
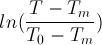
In this experiment, you saved temperature-time data for each sensor including the initial and surrounding fluid temperature. The data analysis involves the following steps:
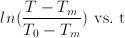
1) Create a column of ln(temperature ratio)
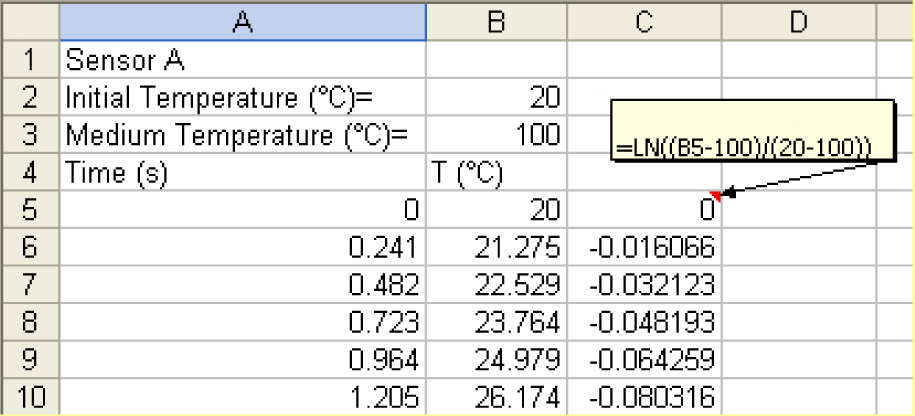
-
2) Create a scatter plot
-
3) Using the trend line analysis, determine the slope of the straight line.
-
4) Determine time constant from slope using the following equation,
- Discuss any observed differences in the time constant values found for different medium temperatures.
- which characteristics of the sensors have the most influence on the time constant?
- If a sensor has a time constant of 3 seoconds, how long would it take to respond to 99% of a sudden change in ambient temperature?
- Annonymous, (2001). "The Temperature Handbook," Omega Engineering Inc, Stamford.
- Doeblin, E.O. (1982). "Measurement Systems, Application and Design," McGraw Hill Book Co, New York.
- Holman, J.P. (2001). "Heat Transfer," 9th ed., McGraw Hill Inc, New York.