Goal: When you have finished this laboratory exercise you will understand
how canned foods are sterillized
and you will learn
the common types of retorts used in the canning industry
the method to obtain temperature at the slowest heating point in a can during heating
the role of different can sizes, initial product temperature, and different heating medium temperature on the calculation of sterilization time.
In the food canning industry, both batch and continuous retorts are used. Retorts operate under atomospheric or higher pressures depending upon the process requirements.
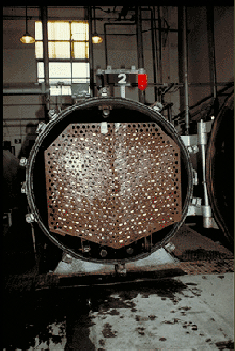
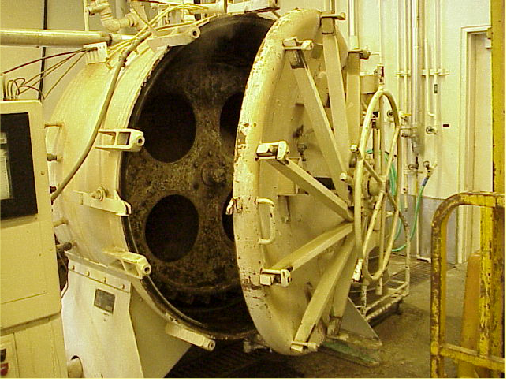
In a batch retort, carts loaded with canned food are pushed into the retort. The retort lid is closed and steam is turned on. After a desired heating period, the steam is turned off, cooling water is introduced to cool the cans. The retort lid is opened and carts are pulled out of the retort.
An animation of a batch retort is shown below. Note that steam is introduced into the retort from steam spargers located in the bottom of the retort.
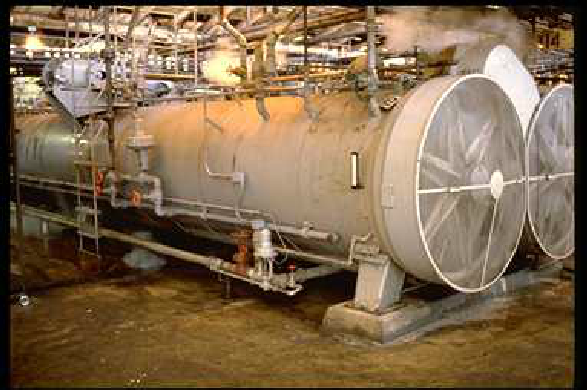
Atmospheric Retort: The following slide shows atmospheric retorts useeeeeeeed in canningg tomato products.
Typically, the atmospheric retort is half filled with hot water (95-98°C). The head space contains steam vapors at atmosphric pressure. Cans enter and exit the retort in a continuous manner.
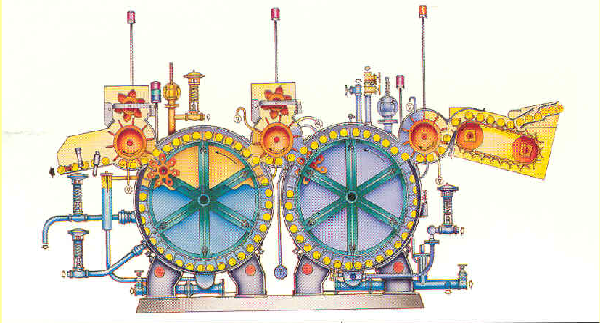
Pressure Retort:
In a pressure retort, steam at a pressure, higher than the atmospheric pressure, is used to process low-acid foods.
In a pressure retort, the entire vessel is filled with steam at high pressure. Cans enter and exit the retort in a continuous manner.
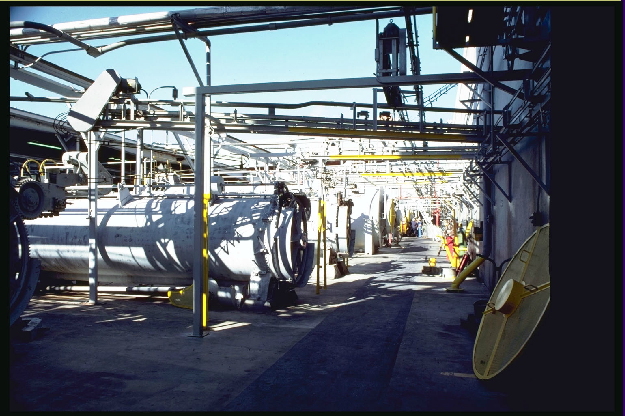
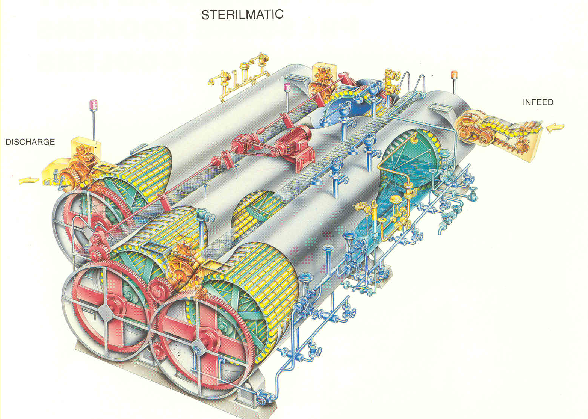
A continuous retort system with a water cooler.
Cross-sectional view of a continuous retort system with a water cooler.
In a laboratory experiment, we install a thermocouple in the center of a can of food. The can is then placed in a retort and heated with steam while the temperature of the food is recorded. The composition of the nectarines used in the experiments is given as follows:
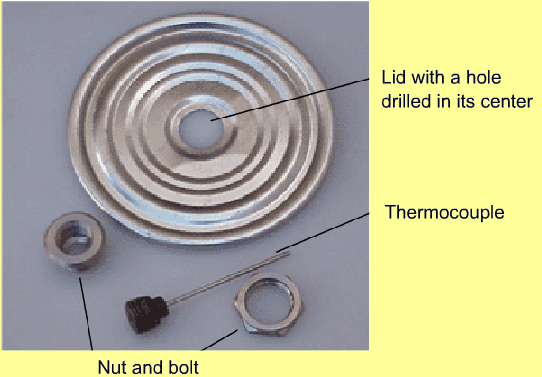
1) To install a thermocouple in the center of a can, a hole is punched in the lid of the can, and special fittings are used to prevent leakage of food during the heating process. the fittings are shown below.
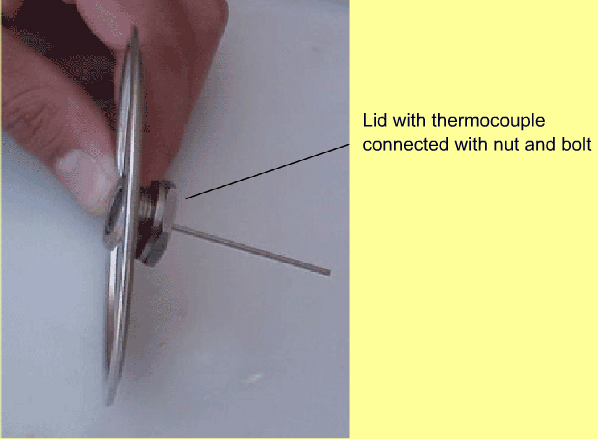
2) The thermocouple fittings are threaded through the lid.
Lid with thermocouple connected with nut and bolt.
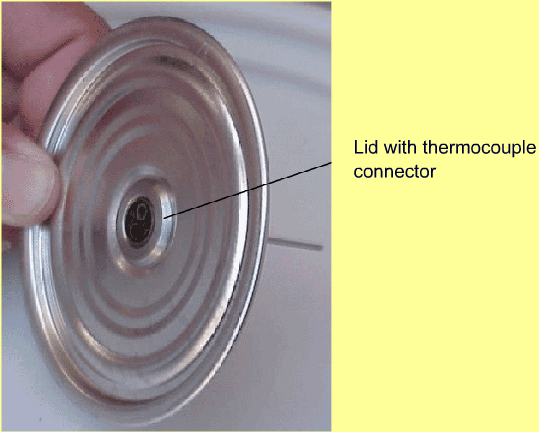
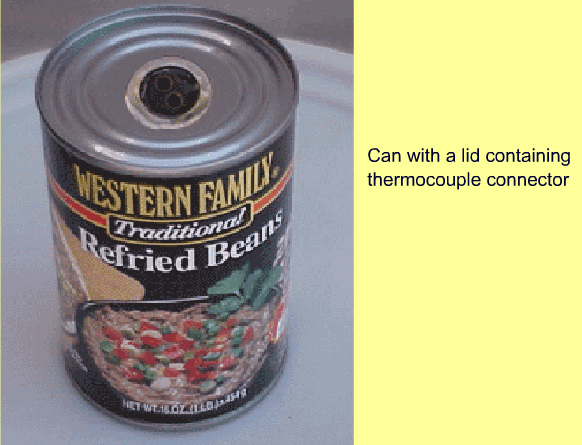
3) A can lid fitted with a thermocouple connector is shown below.
Lid with thermocouple connector
4) Using a canning machine, the lid, containing the thermocouple-connector, is attached to the can.
Lid with thermocouple connector
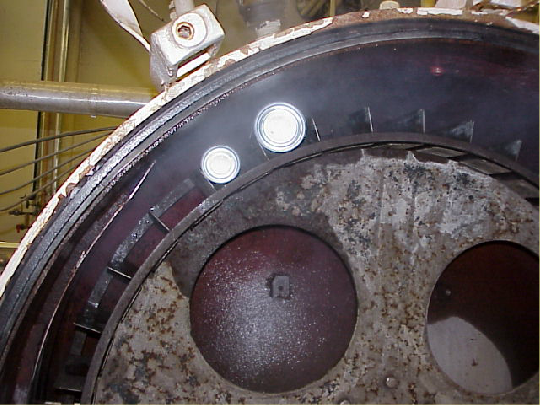
5) The can, containing the thermocouple, is placed in the retort. Care is taken to prevent the thermcouple wire from entangling with the rotor.
Lid with thermocouple connector
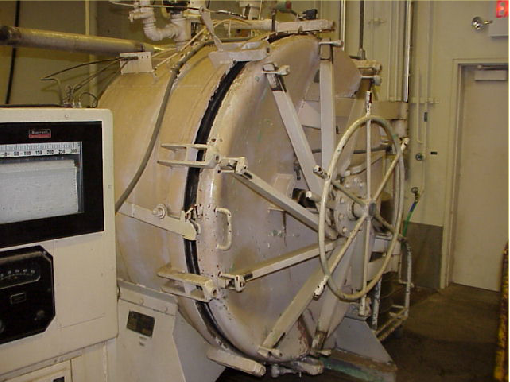
6) The retort lid is closed and steam is turned on. A data acquisition system is used to record the temperature of the steam and center temperature of the can.
Lid with thermocouple connector
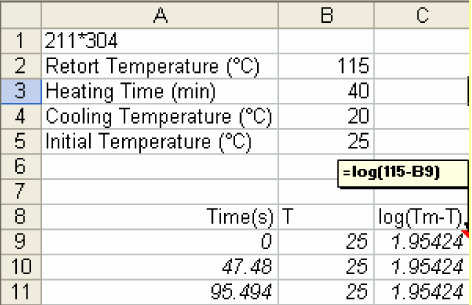
In a virtual experiment, you first select the can size from the three given choices. Set the desired retort temperature, cooling medium temperature, heating time, and initial temperature. The results will include the temperature plot. The recorded data will include temperature at three locations, can center, near the can wall, and a location midway between the center and the can wall.
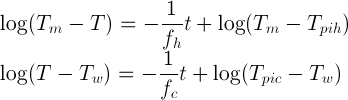
The heating and cooling curves are described by the following equations:
where Tm is the heating medium temperatur, T is temperature at any time, t is time, fh is the heating rate parameter, Tpih is the pseudo initial temperature for cooling curve, fc is the cooling rate parameter.
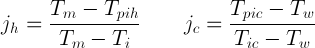
From the heating/cooling curve, we also obtain two other parameters, jh and jc as follows:
where Tm is the heating medium temperature, Tpih is the pseudo initial temperature for the heating curve, Ti is the initial product temperature at beginning of heating, Tw is the cooling medium temperature, Tpic is the pseudo initial temperature for the cooling curve, Tic is the initial product temperature at the start of the cooling cycle.
fh, fc, jh and jc are used in conducting thermal process calculations.
t =
(min)
In this experiment, temperature vs. time data were obtained for conduction-heating of a canned food. Analyze these data using the following steps:
Determine the heating and cooling rates for each of these locations. The heating rate parameter, called fh, is etermined from the temperature vs. time data obtained during heating. The cooling rate parameter, fc is obtained from the cooling part of the temperature vs. time data.
To calculate fh:
a) Prepare a new column on your spreadsheet for log(Tm-T) where Tm is the retort temperature, and T is the variable temperature at a given location.
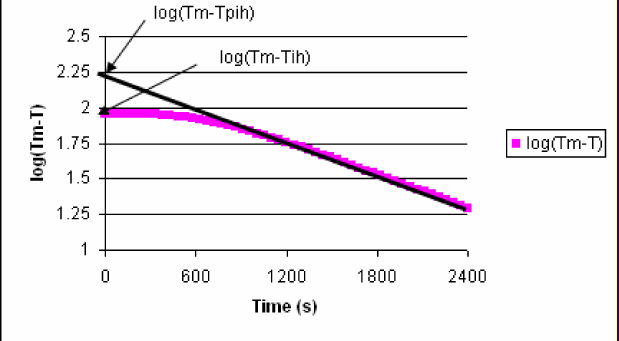
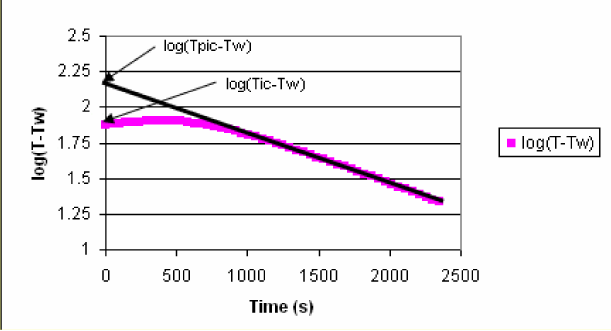
b) Make a plot of log(Tm -T) vs. time. You will obtain a straight line with a small non-linear portion at the beginning. Determine the time when the linear portion begins. Note that Tpih is the intercept temperature of the linear portion of the curve.
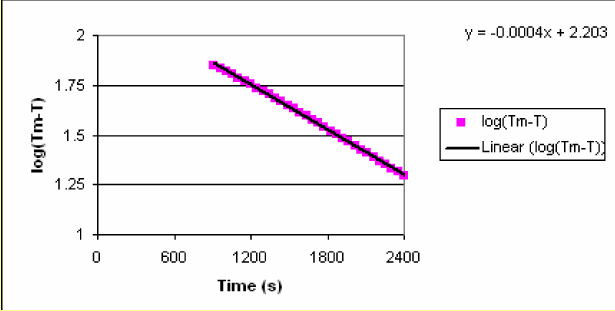
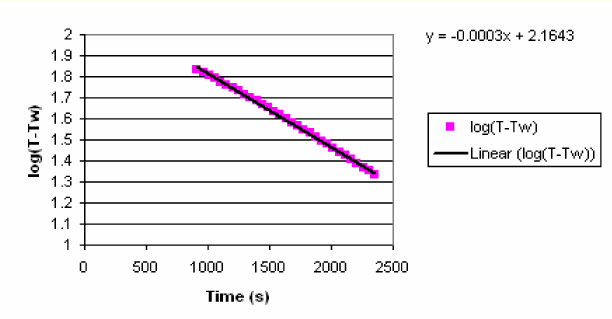
c) Use trend line analysis for the log(Tm -T) vs. time data for the linear portion of the plot to obtain slope and intercept values.
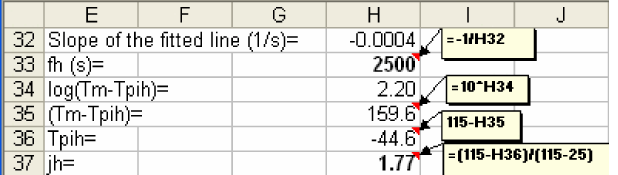
d) Using slope and intercept, calculate fh and jh values.
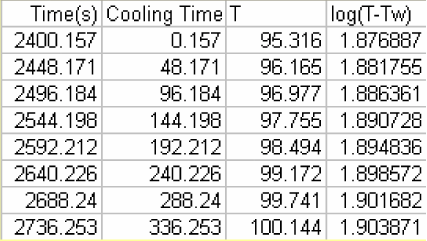
e) For calculating cooling rate parameters, use the temperature-time data for the cooilng period. Note that in this example, cooling started at 2400.157s. Create a new time column, by re-initializing the cooling data so that it begins with time zero by subtracting 2400 from the time after cooling begins. Also create a column for log(T - Tw).
f) Create an XY scatter plot oflog(T - Tw) vs. time.
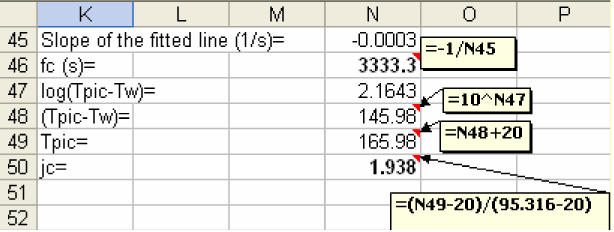
g) Use trendline analysis for the log(T - Tw) vs time data for the linear portion of the plot to obtain slope and intercept.
h) Using the slope and intercept, calculate fc and jc.
How are the fh and fc values affected by location and time? Discuss the reasons.
Does the j-value change by location or time? Discuss the reasons.
Where would you expect the slowest heating point in a can of conduction heated food to be located? Discuss the reasons.
Can f- and j-values be used to determine the time required for the slowest heating point in the can to reach a selected temperature? Discuss.